Call Stack Information Commands
Describes how to use the debug monitor commands to get information about the call stack.
General points
Tracing the call stack is an advanced use of the m command that allows you to examine memory.
Every time a function is called, the return address is automatically saved into register R14 (Link Register). In addition to this the return address is generally pushed onto the call stack; it is always pushed in debug builds but the push operation is sometimes optimized out in release builds. This allows you to trace back through the value of R14 and these saved addresses to see the sequence of function calls. Unfortunately this is quite tedious to do because the stack is also used for automatic variables and other data. You need to work out which values on the stack refer to return addresses.
When you are debugging only ROM-based code, it is relatively easy to identify the pushed return addresses because all code addresses will be in the ROM range: 0xF800000 to 0xFFEFFFFF for the moving model. However, there is also data in the ROM, which means that an address on the stack which is in the ROM range could point to data instead of code. If you want to trace applications loaded into RAM, i.e. anything not run from drive Z:, then stack tracing is more difficult because the code can move about and RAM-loaded code is given an address assigned at load time.
Note that using the MAKSYM tool is essential for tracing back through the stack.
Finding the stack
To trace back through a thread’s kernel or user stack, you first need to find the stack pointer value. On the ARM, R13 always points to the stack, but there are different R13 registers for each processor mode:
To find out which stack to inspect, you need to know what mode the CPU was in when the fault occurred. The processor mode is identified by the five least-significant bits of the CPSR register. To get the value of the CPSR register:
use the f command when the debug monitor is triggered by a hardware exception.
use the r command when the debug monitor is triggered by a panic.
The following examples show how to find the stack(s):
Kernel & user stacks of the current thread after a hardware exception
Use the f command.
Fault Category: Exception  Fault Reason: 10000000
ExcId 00000001 CodeAddr f816c908 DataAddr 80000001 Extra c0007003
Exc 1 Cpsr=60000010 FAR=80000001 FSR=c0007003
 R0=00000000  R1=00000000  R2=30000000  R3=80000001
 R4=00000001  R5=00403d88  R6=00002000  R7=f816c768
 R8=00000012  R9=00000040 R10=00000000 R11=00403fa4
R12=00403d5c R13=00403d70 R14=f80906f8 R15=f816c908
R13Svc=6571e000 R14Svc=f80074bc SpsrSvc=80000010
In this example:
the kernel stack is the value of R13Svc, i.e. 0x6571e00.
the user stack is the value of R13, i.e. 0x00403d70.
Kernel & user stacks of the current thread after a panic
Use the r command.
MODE_USR:
 R0=6571de54  R1=0000002a  R2=00000002  R3=ffffffff
 R4=0000002a  R5=f8170414  R6=6571df14  R7=6403cc50
 R8=00000001  R9=6403c44c R10=640002f8 R11=6571de70
R12=00000020 R13=00404e00 R14=f80818c0 R15=f800bfa8
CPSR=60000013
MODE_FIQ:
 R8=00000000  R9=ffffffff R10=ffffffff R11=00000000
R12=00000000 R13=64000d0c R14=c080079c SPSR=e00000dc
MODE_IRQ:
R13=6400110c R14=00000013 SPSR=20000013
MODE_SVC:
R13=6571de54 R14=f80328bc SPSR=60000010
MODE_ABT:
R13=6400090c R14=ccbfd0e0 SPSR=b00000d9
MODE_UND:
R13=6400090c R14=b5a39950 SPSR=f000009d
In this example:
the kernel stack is the value of R13 under MODE_SVC:, i.e. 0x6571de54.
the user stack is the value of R13 under MODE_USR:, i.e. 0x00404e00.
Use the r command.
MODE_USR:
 R0=6571de54  R1=0000002a  R2=00000002  R3=ffffffff
 R4=0000002a  R5=f8170414  R6=6571df14  R7=6403cc50
 R8=00000001  R9=6403c44c R10=640002f8 R11=6571de70
R12=00000020 R13=00404e00 R14=f80818c0 R15=f800bfa8
CPSR=60000013
MODE_FIQ:
 R8=00000000  R9=ffffffff R10=ffffffff R11=00000000
R12=00000000 R13=64000d0c R14=c080079c SPSR=e00000dc
MODE_IRQ:
R13=6400110c R14=00000013 SPSR=20000013
MODE_SVC:
R13=6571de54 R14=f80328bc SPSR=60000010
MODE_ABT:
R13=6400090c R14=ccbfd0e0 SPSR=b00000d9
MODE_UND:
R13=6400090c R14=b5a39950 SPSR=f000009d
In this example:
the IRQ stack is the value of R13 under MODE_IRQ:, i.e. 0x6400110c.
the FRQ stack is the value of R13 under MODE_FIQ:, i.e. 0x64000d0c.
Kernel & user stacks of a non-current thread
Use the output of the i, q and c0 commands.
THREAD at 6403c194 VPTR=f8046c18 AccessCount=5 Owner=6403bb4c
Full name t_dmasim::Main
Thread MState READY
Default priority 12 WaitLink Priority 12
ExitInfo 3,0,
Flags 00000002, Handles 6403b418
Supervisor stack base 6571d000 size 1000
User stack base 00403000 size 2000
Id=25, Alctr=00700000, Created alctr=00700000, Frame=00000000
Trap handler=00000000, ActiveScheduler=007000c8, Exception handler=00000000
TempObj=00000000 TempAlloc=00000000
NThread @ 6403c44c Pri 12 NState READY
Next=6403c44c Prev=6403c44c Att=03 iUserContextType=02
HeldFM=00000000 WaitFM=00000000 AddrSp=6403bb4c
Time=0 Timeslice=20 ReqCount=0
SuspendCount=0 CsCount=1 CsFunction=00000000
SavedSP=6571df98
DACR f800bd2c
R13_USR 0d404c38 R14_USR 00000001 SPSR_SVC 00000000
 R4 f8022d84  R5 6571dfd4  R6 6571dfbc  R7 f8022db8
 R8 f800bddc  R9 f800a454 R10 00000000 R11 f801daac
 PC 60000010
In this example:
Tracing through the stack heuristically
One way of tracing through the call stack is to assume that every word on the stack which looks like a ROM code address is a saved return address. We say that this heuristic because:
some data words may look like code addresses in ROM.
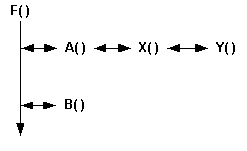
there may be saved return addresses left over from previous function calls. For example, suppose that F() calls A() and then B() in sequence. A() itself calls X(), which calls Y(). If a crash occurs in B(), the saved return addresses from the calls to X() and Y() are still present on the stack and may be mistaken for function calls occuring while B() is active.
This scenario happens frequently when B() allocates a buffer (e.g. TBuf) on the stack which overlaps old stack frames.
If you want to trace applications loaded into RAM, then stack tracing is more difficult because RAM-loaded DLLs are given addresses assigned at load time.
On ARM, the stack pointer starts at the higher address end and moves 'down' towards the lower address end. This means that values at the top of the memory dump are more recent. You need to look back through this for code addresses. For ROM code this will be words with most significant byte in the range 0xF8 to 0xFF, remembering that they are little-endian. This can either be done manually, or automatically using the printsym.pl perl script, which can be found in ...\epoc32\tools.
Let's follow this in an example session:
Decide whether the crash has been caused by a panic or an exception using the f command:
.f
Fault Category: EXAMPLE  Fault Reason: 0000002a
ExcId 00000000 CodeAddr 00000000 DataAddr 00000000 Extra 00000000
This shows that the crash was caused by a panic, so now use the r command to find the CPU mode and the stack pointer:
.r
MODE_USR:
 R0=6571de54  R1=0000002a  R2=00000002  R3=ffffffff
 R4=0000002a  R5=f8170414  R6=6571df14  R7=6403cba8
 R8=00000001  R9=6403c41c R10=640002f8 R11=6571de70
R12=00000020 R13=00404e00 R14=f80818c0 R15=f800bfa8
CPSR=60000013
MODE_FIQ:
 R8=00000000  R9=ffffffff R10=ffffffff R11=00000000
R12=00000000 R13=64000d0c R14=c080079c SPSR=e00000dc
MODE_IRQ:
R13=6400110c R14=00000013 SPSR=20000013
MODE_SVC:
R13=6571de54 R14=f80328bc SPSR=60000010
MODE_ABT:
R13=6400090c R14=ffff0010 SPSR=400000d7
MODE_UND:
R13=6400090c R14=95221110 SPSR=f000009d
The panic happened in supervisor mode, because CPSR & 0x1F == 0x13, so R13Svc, i.e. the value of R13 shown under MODE_SVC: in the above display, is the stack pointer to look at; this has the value 0x6571DE54.
Using the m command to look at memory starting at location 0x6571DE54 gives:
.m6571de54+200
6571de54: 07 00 00 10 14 04 17 f8 00 00 00 00 d4 4e 40 00 .............N@.
6571de64: e8 de 71 65 74 de 71 65 74 fb 16 f8 88 28 03 f8 ..qet.qet....(..
6571de74: 0c d4 03 f8 64 35 03 f8 00 00 00 00 00 00 00 00 ....d5..........
6571de84: d0 00 00 00 14 df 71 65 a8 cb 03 64 a8 cb 03 64 ......qe...d...d
6571de94: d0 00 00 00 14 df 71 65 1c df 71 65 ec 4e 40 00 ......qe..qe.N@.
6571dea4: 1c c4 03 64 b4 2a 03 f8 00 00 00 00 14 df 71 65 ...d.*........qe
6571deb4: d0 de 71 65 c4 de 71 65 b0 ab 03 f8 00 00 00 00 ..qe..qe........
6571dec4: e0 ba 03 64 14 df 71 65 1c df 71 65 01 00 00 00 ...d..qe..qe....
6571ded4: 1c c4 03 64 f8 02 00 64 10 df 71 65 ec de 71 65 ...d...d..qe..qe
6571dee4: 84 da 01 f8 5c fb 16 f8 00 4e 40 00 00 00 00 00 ....\....N@.....
6571def4: 00 4e 40 00 00 00 00 00 d3 00 00 00 ec 4e 40 00 .N@..........N@.
6571df04: d4 df 71 65 14 df 71 65 e0 db 01 f8 c0 d9 01 f8 ..qe..qe........
6571df14: a8 cb 03 64 e0 ba 03 64 01 00 01 00 00 00 00 00 ...d...d........
6571df24: 00 00 00 00 d4 4e 40 00 00 00 00 30 40 00 00 00 .....N@....0@...
6571df34: 13 00 00 60 98 df 71 65 48 df 71 65 f4 81 00 f8 ...`..qeH.qe....
6571df44: 8c 7a 00 f8 68 df 71 65 58 df 71 65 6c df 71 65 .z..h.qeX.qel.qe
6571df54: 60 df 71 65 0c 2b 00 f8 bc 2a 00 f8 84 df 71 65 `.qe.+...*....qe
6571df64: 70 df 71 65 e4 7d 04 f8 08 2b 00 f8 0d 00 00 00 p.qe.}...+......
6571df74: 0a 00 00 30 40 00 00 00 54 65 73 74 44 6d 61 53 ...0@...TestDmaS
6571df84: 69 6d 04 f8 a9 4b 40 00 b8 df 71 65 9c df 71 65 im...K@...qe..qe
6571df94: 2c be 00 f8 2c bd 00 f8 38 4c 40 0d 01 00 00 00 ,...,...8L@.....
6571dfa4: 00 00 00 00 84 2d 02 f8 d4 df 71 65 bc df 71 65 .....-....qe..qe
6571dfb4: b8 2d 02 f8 dc bd 00 f8 54 a4 00 f8 00 00 00 00 .-......T.......
6571dfc4: ac da 01 f8 10 00 00 60 d8 df 71 65 70 74 00 f8 .......`..qept..
6571dfd4: b8 da 01 f8 d4 4e 40 00 20 f7 16 f8 d0 4e 40 00 .....N@. ....N@.
6571dfe4: 00 00 00 00 00 00 00 00 ec 4e 40 00 40 00 00 00 .........N@.@...
We can look for potential ROM addresses by scanning the log and look up the corresponding function name in the symbol file generated using the MAKSYM tool . The first one is 0xF8170414 at offset 4 in the memory dump.
Alternatively, we can use the printsym.pl perl script, passing it the dump output. The following is part of the output:
R:\base\e32\rombuild>perl -S printsym.pl ASSABETARM4D.symbol
ROM Symbols from ASSABETARM4D.symbol
Please enter data to be decoded
6571de54: 07 00 00 10 14 04 17 f8 00 00 00 00 d4 4e 40 00 .............N@.
= 10000007 ....
= f8170414 ....  etext=. + 0x0
= 00000000 ....
= 00404ed4 .N@.
6571de64: e8 de 71 65 74 de 71 65 74 fb 16 f8 88 28 03 f8 ..qet.qet....(..
= 6571dee8 ..qe
= 6571de74 t.qe
= f816fb74 t...  DDmaTestChannel::DoCreate(int, TDesC8 const *, TVersion const &
) + 0x24
= f8032888 .(..  Kern::Fault(char const *, int) + 0xc
6571de74: 0c d4 03 f8 64 35 03 f8 00 00 00 00 00 00 00 00 ....d5..........
= f803d40c ....  RHeap::Alloc(int) + 0xf4
= f8033564 d5..  Kern::MutexSignal(DMutex &) + 0xc
= 00000000 ....
= 00000000 ....

[............ truncated ...............]

= f801da84 ....  DLogicalDevice::ChannelCreate(DLogicalChannelBase *&, TChannelC
reateInfo &) + 0xd0
= f816fb5c \...  DDmaTestChannel::DoCreate(int, TDesC8 const *, TVersion const &
) + 0xc
= 00404e00 .N@.
= 00000000 ....
6571def4: 00 4e 40 00 00 00 00 00 d3 00 00 00 ec 4e 40 00 .N@..........N@.
= 00404e00 .N@.
= 00000000 ....
= 000000d3 ....
= 00404eec .N@.
6571df04: d4 df 71 65 14 df 71 65 e0 db 01 f8 c0 d9 01 f8 ..qe..qe........
= 6571dfd4 ..qe
= 6571df14 ..qe
= f801dbe0 ....  ExecHandler::ChannelCreate(TDesC8 const &, TChannelCreateInfo &
, int) + 0x134
= f801d9c0 ....  DLogicalDevice::ChannelCreate(DLogicalChannelBase *&, TChannelC
reateInfo &) + 0xc

[.......................... truncated .........................]

= f8022db8 .-..  ExecHandler::DebugPrint(void *, int) + 0x34
= f800bddc ....  A::UserDebugPrint(unsigned char const *, int, int) + 0xc
= f800a454 T...  EpocSlowExecTable + 0xc
= 00000000 ....
6571dfc4: ac da 01 f8 10 00 00 60 d8 df 71 65 70 74 00 f8 .......`..qept..
= f801daac ....  ExecHandler::ChannelCreate(TDesC8 const &, TChannelCreateInfo &
, int) + 0x0
= 60000010 ...`
= 6571dfd8 ..qe
= f8007470 pt..  __ArmVectorSwi + 0xd8
6571dfd4: b8 da 01 f8 d4 4e 40 00 20 f7 16 f8 d0 4e 40 00 .....N@. ....N@.
= f801dab8 ....  ExecHandler::ChannelCreate(TDesC8 const &, TChannelCreateInfo &
, int) + 0xc
= 00404ed4 .N@.
= f816f720  ...  etext=. + 0x560
= 00404ed0 .N@.
6571dfe4: 00 00 00 00 00 00 00 00 ec 4e 40 00 40 00 00 00 .........N@.@...
= 00000000 ....
= 00000000 ....
= 00404eec .N@.
= 00000040 @...
^C
R:\base\e32\rombuild>
There are several false positives in this output (and even more in the truncated parts). So some study of the source code is needed to discard the noise and find the actual call stack. Here it is (innermost frame first):
Note that for the sake of the example, a call to Kern::Fault() was deliberately inserted into DDmaTestChannel::DoCreate().
All other function names are false positives and should be ignored.
Walking through the call stack
The heuristic method is quick but produces lots of false positives. Another option is to manually reconstitute the call stack from the memory dump. This is relatively easy for debug builds because GCC uses R11 as a frame pointer (FP) and generates the same prologue/epilogue for every function.
For release builds, there is no generic solution. It is necessary to check the generated assembler code as there is no standard prologue/epilogue and R11 is not used as frame pointer.
A typical prologue for a debug ARM function looks like this:
mov        ip, sp
stmfd    sp!, {fp, ip, lr, pc}
sub        fp, ip, #4        /* FP now points to base of stack frame */
sub        sp, sp, #16    /* space for local variables */
noting that: SP = R13, FP = R11, IP = R12, LR = R14, and PC = R15.
This code creates the following stack frame:
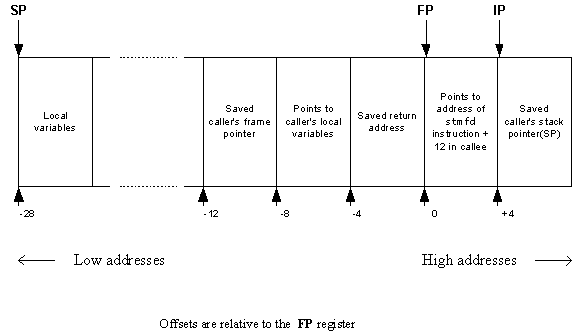
Looking at the example session listed in when tracing through the stack heuristically. in which the crash is due to a panic, the FP value is the R11 value; this is 0x6571de70. This gives us the innermost stack frame:
6571de64:    e8 de 71 65 <------------- pointer to previous stack frame
            74 de 71 65
            74 fb 16 f8 <------------- Saved return address
            88 28 03 f8 <------------- FP points to this word
Looking up the saved return address, 0xf816fb74, in the symbol file shows that the current function was called from DDmaChannel::DoCreate().
f816fb50    0198    DDmaTestChannel::DoCreate(int, TDesC8 const *, TVersion const &)
f816fce8    007c    DDmaTestChannel::~DDmaTestChannel(void)
f816fd64    0294    DDmaTestChannel::Request(int, void *, void *)
Using the pointer to the previous stack frame saved into the current frame, we can decode the next frame:
6571ded4:    1c c4 03 64
            f8 02 00 64
            10 df 71 65 <------------- pointer to previous stack frame
            ec de 71 65

6571dee4:    84 da 01 f8 <------------- saved return address
            5c fb 16 f8 <------------- start of second stack frame
            00 4e 40 00
            00 00 00 00
Looking up the saved return address, 0xf801da84, in the symbol file shows that DDmaTestChannel::DoCreate() was called from DLogicalDevice::ChannelCreate().
f801d9b4    00f8    DLogicalDevice::ChannelCreate(DLogicalChannelBase *&, TChannelCreateInfo &)
f801daac    01b8    ExecHandler::ChannelCreate(TDesC8 const &, TChannelCreateInfo &, int)
f801dc64    00e4    ExecHandler::ChannelRequest(DLogicalChannelBase *, int, void *, void *)
And here is the third stack frame:
6571df04:    d4 df 71 65 <------------- pointer to previous stack frame
            14 df 71 65
            e0 db 01 f8 <------------- saved return address
            c0 d9 01 f8 <------------- start of third stack frame
So DLogicalDevice::ChannelCreate() was called from ExecHandler::ChannelCreate().
Note that this mechanical way of walking the stack is valid only for debug functions. For release functions, it is necessary to study the code generated by the compiler.
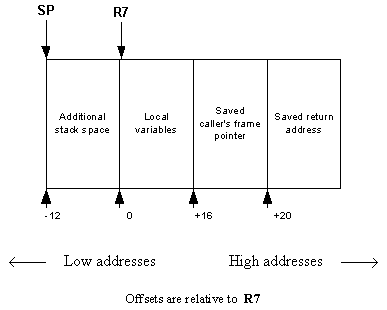
For completness, this is a typical prologue for a debug THUMB function:
push    { r7, lr }
sub        sp, #28
add        r7, sp, #12 /* R7 is THUMB frame pointer */
and this creates the following stack frame:
A call stack can mix ARM and THUMB frames. Odd return addresses are used for THUMB code and even ones for ARM code.
Copyright ©2010 Nokia Corporation and/or its subsidiary(-ies).
All rights
reserved. Unless otherwise stated, these materials are provided under the terms of the Eclipse Public License
v1.0.